


Financial Indicators
| Dec. 2012 | Dec. 2013 | Dec. 2014 | Dec. 2015 | Dec. 2016 | |
|---|---|---|---|---|---|
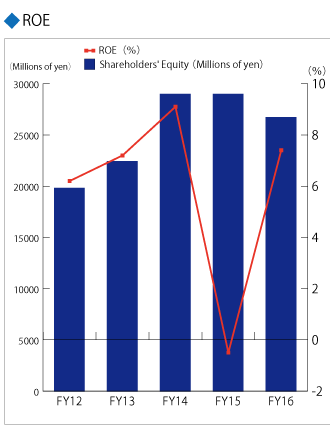
| ROE | 6.2% | 7.2% | 9.1% | (0.5%) | 7.4% |
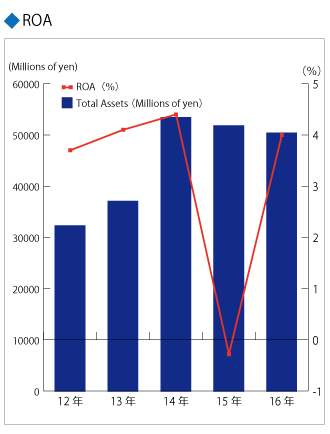
| ROA | 3.7% | 4.1% | 4.4% | (0.3%) | 4.1% |
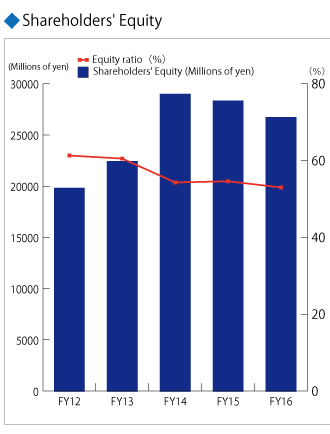
| Shareholders' Equity (Millions of yen) | 197,75 | 22,392 | 28,966 | 28,294 | 26,677 |
| Equity Ratio | 61.3% | 60.5% | 54.3% | 54.6% | 53.0% |
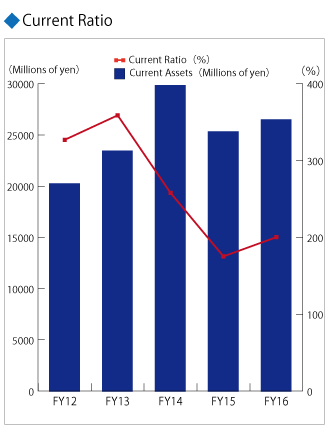
| Current Ratio | 327.0% | 358.9% | 257.8% | 175.3% | 200.2% |
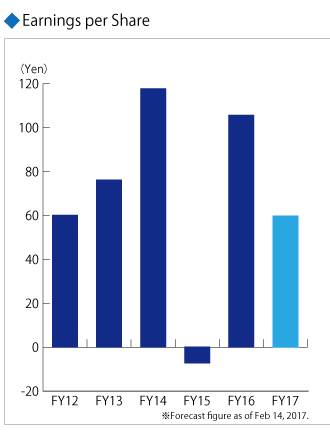
| Earnings per Share (yen) | 60.00 | 76.08 | 117.70 | (7.22) | 105.55 |
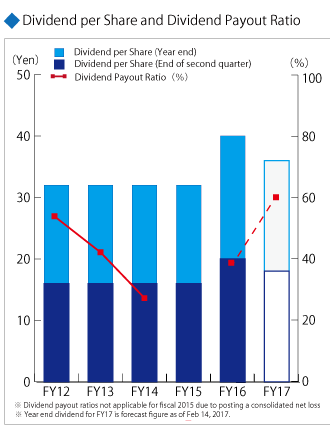
| Dividend per Share (yen) | 32 | 32 | 32 | 32 | 40 |
| Dividend Payout Ratio | 53.3% | 42.1% | 27.2% | ― | 37.9% |
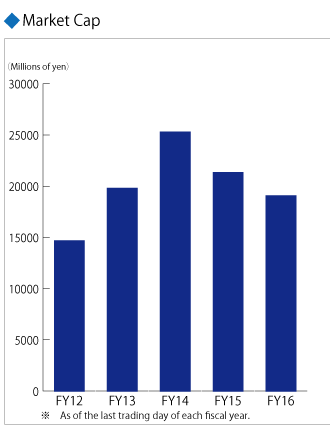
| Market Cap ※1 (Millions of yen) |
14,669 | 19,775 | 25,268 | 21,325 | 19,042 |
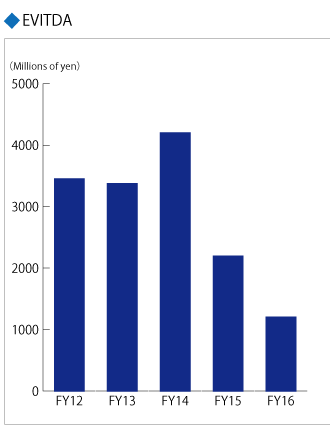
| EVITDA ※2 (Millions of yen) |
3,450 | 3,374 | 4,202 | 2,195 | 1,202 |
※1 As of the last trading day of each fiscal year.※2 EVITDA is the total of "operating income", "depreciation" and "amortization of goodwill".