


Operating Results
| Dec. 2013 | Dec. 2014 | Dec. 2015 | Dec. 2016 | Dec. 2017※ | |
|---|---|---|---|---|---|
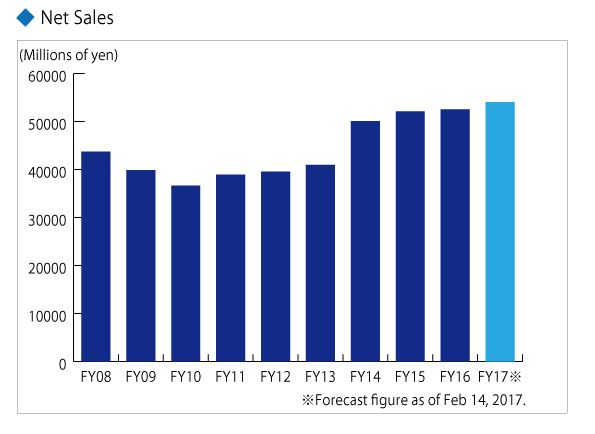
| Net Sales | 40,963 | 50,031 | 52,105 | 52,521 | 54,000 |
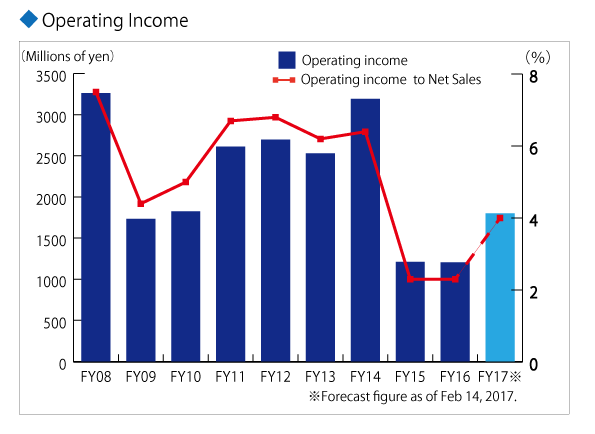
| Operating Income | 2,528 | 3,191 | 1,209 | 1,202 | 1,800 |
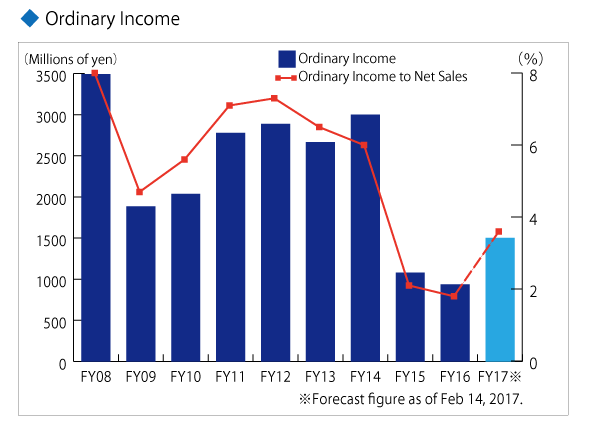
| Ordinary Income | 2,664 | 3,000 | 1,080 | 937 | 1,500 |
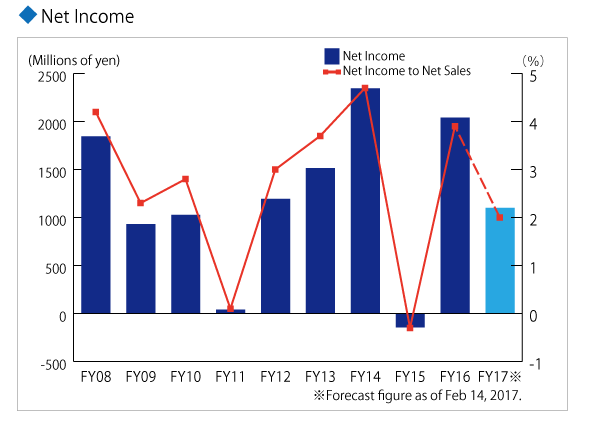
| Net Income | 1,514 | 2,343 | (142) | 2,039 | 1,100 |
| Dec. 2008 | Dec. 2009 | Dec. 2010 | Dec. 2011 | Dec. 2012 | |
|---|---|---|---|---|---|
| Net Sales | 43,701 | 39,842 | 36,614 | 38,882 | 39,545 |
| Operating Income | 3,260 | 1,733 | 1,822 | 2,610 | 2,694 |
| Ordinary Income | 3,491 | 1,884 | 2,035 | 2,776 | 2,887 |
| Net Income | 1,844 | 929 | 1,026 | 39 | 1,194 |
※Forecast figure as of February 14, 2017.