Financial Indicators
| Dec. 2020 | Dec. 2021 | Dec. 2022 | Dec. 2023 | Dec. 2024 | |
|---|---|---|---|---|---|
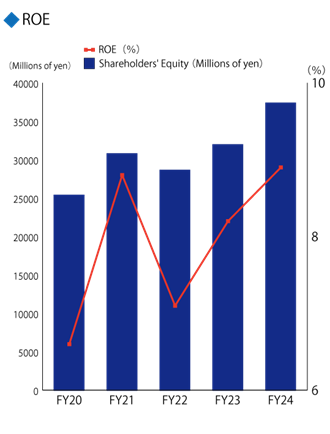
| ROE | 6.6% | 8.8% | 7.1% | 8.2% | 8.9% |
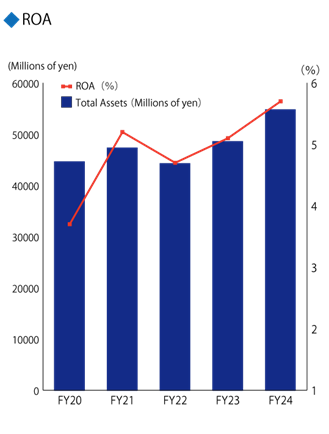
| ROA | 3.7% | 5.2% | 4.7% | 5.1% | 5.7% |
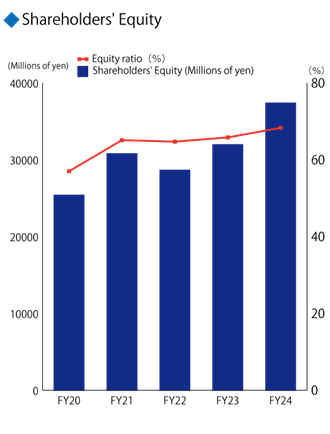
| Shareholders' Equity (Millions of yen) | 25,382 | 30,769 | 28,620 | 31,939 | 37,368 |
| Equity Ratio | 57.0% | 65.1% | 64.7% | 65.8% | 68.3% |
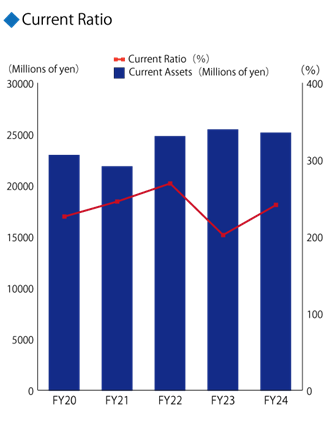
| Current Ratio | 226.9% | 245.5% | 269.1% | 202.3% | 241.1% |
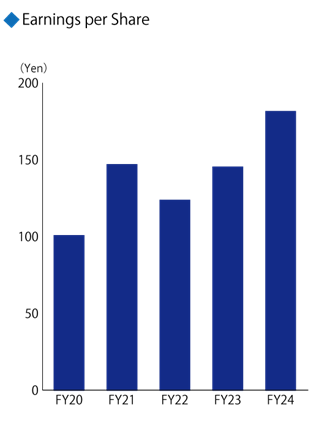
| Earnings per Share (yen) | 100.55 | 146.76 | 123.6 | 145.24 | 181.38 |
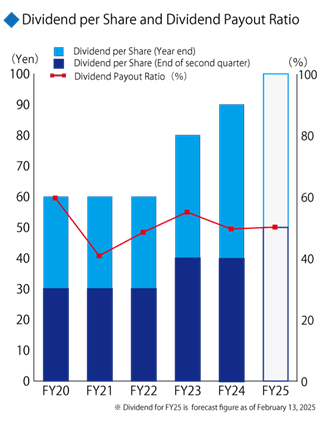
| Dividend per Share (yen) | 60 | 60 | 60 | 80 | 90 |
| Dividend Payout Ratio | 59.7% | 40.9% | 48.5% | 55.1% | 49.6% |
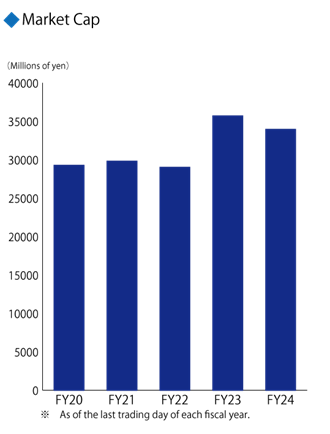
| Market Cap ※ (Millions of yen) |
29,250 | 29,805 | 29,415 | 35,721 | 33,934 |
※ As of the last trading day of each fiscal year.