Status by Segment
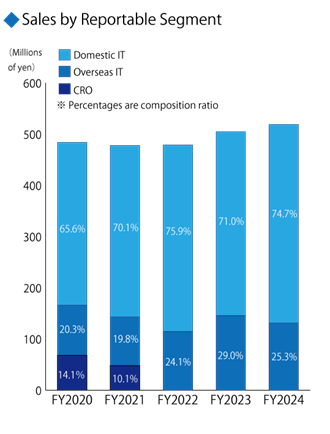
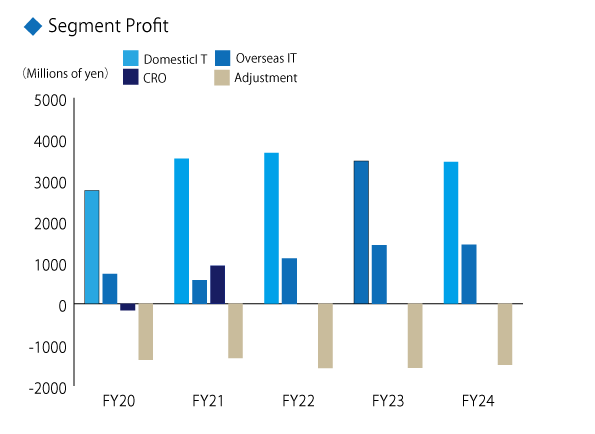
Sales and Segment profit by Reportable Segment
(Millions of yen)
| Dec. 2020 | Dec. 2021 | Dec. 2022 | Dec. 2023 | Dec. 2024 | ||
|---|---|---|---|---|---|---|
| Domestic IT | Sales | 31,852 | 33,586 | 36,406 | 35,905 | 38,866 |
| Segment profit | 2,753 | 3,525 | 3,668 | 3,468 | 3,449 | |
| Overseas IT | Sales | 9,865 | 9,507 | 11,565 | 14,633 | 13,196 |
| Segment profit | 723 | 570 | 1,089 | 1,420 | 1,430 | |
| CRO | Sales | 6,820 | 4,841 | - | - | - |
| Segment profit | (161) | 922 | - | - | - | |
| Adjustment | Segment profit | (1,366) | (1,321) | (1,569) | (1,561) | (1,485) |
Due to the sale of the CRO business, from fiscal 2023 (fiscal year ended December 2023), the reportable segments will be changed to domestic IT and overseas IT.
The Company has also changed, from the first three months of the fiscal year 2023, its method for calculating segment profit. Consequently, the amounts of adjustment reflect corporate expenses that are
not allocated to individual reportable segments. The figures for the FY 2020 and after also reflect the same change.
<Domestic IT>
Provides system development services, system operation and management services, human resource BPO services, etc. at domestic subsidiaries.
<Overseas IT>
Provides system development services, system operation and management services, maintenance services, etc. at overseas subsidiaries.
<CRO>
Provides pharmaceutical companies with contract and proxy services for clinical testing (clinical development) and post-manufacturing and sales operations associated with pharmaceutical development.
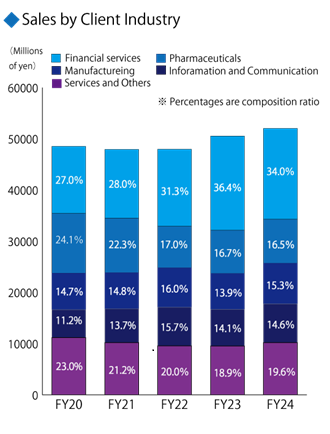
Sales by Client Industry
(Millions of yen)
| Dec. 2020 | Dec. 2021 | Dec. 2022 | Dec. 2023 | Dec. 2024 | |
|---|---|---|---|---|---|
| Financial services | 13,086 | 13,403 | 15,033 | 18,382 | 17,717 |
| Pharmaceuticals | 11,680 | 10,677 | 8,135 | 8,449 | 8,598 |
| Manufacturings | 7,140 | 7,089 | 7,693 | 7,028 | 7,952 |
| Information & Communications | 5,451 | 6,555 | 7,528 | 7,130 | 7,599 |
| Servies and others | 11,180 | 10,209 | 9,580 | 9,549 | 10,195 |
From the FY 2020, the Company has changed classifications by industry in order to show the characteristics of the Group more clearly.